After an event, a dashboard full of counters can make one question harder to answer: did the card actually work?
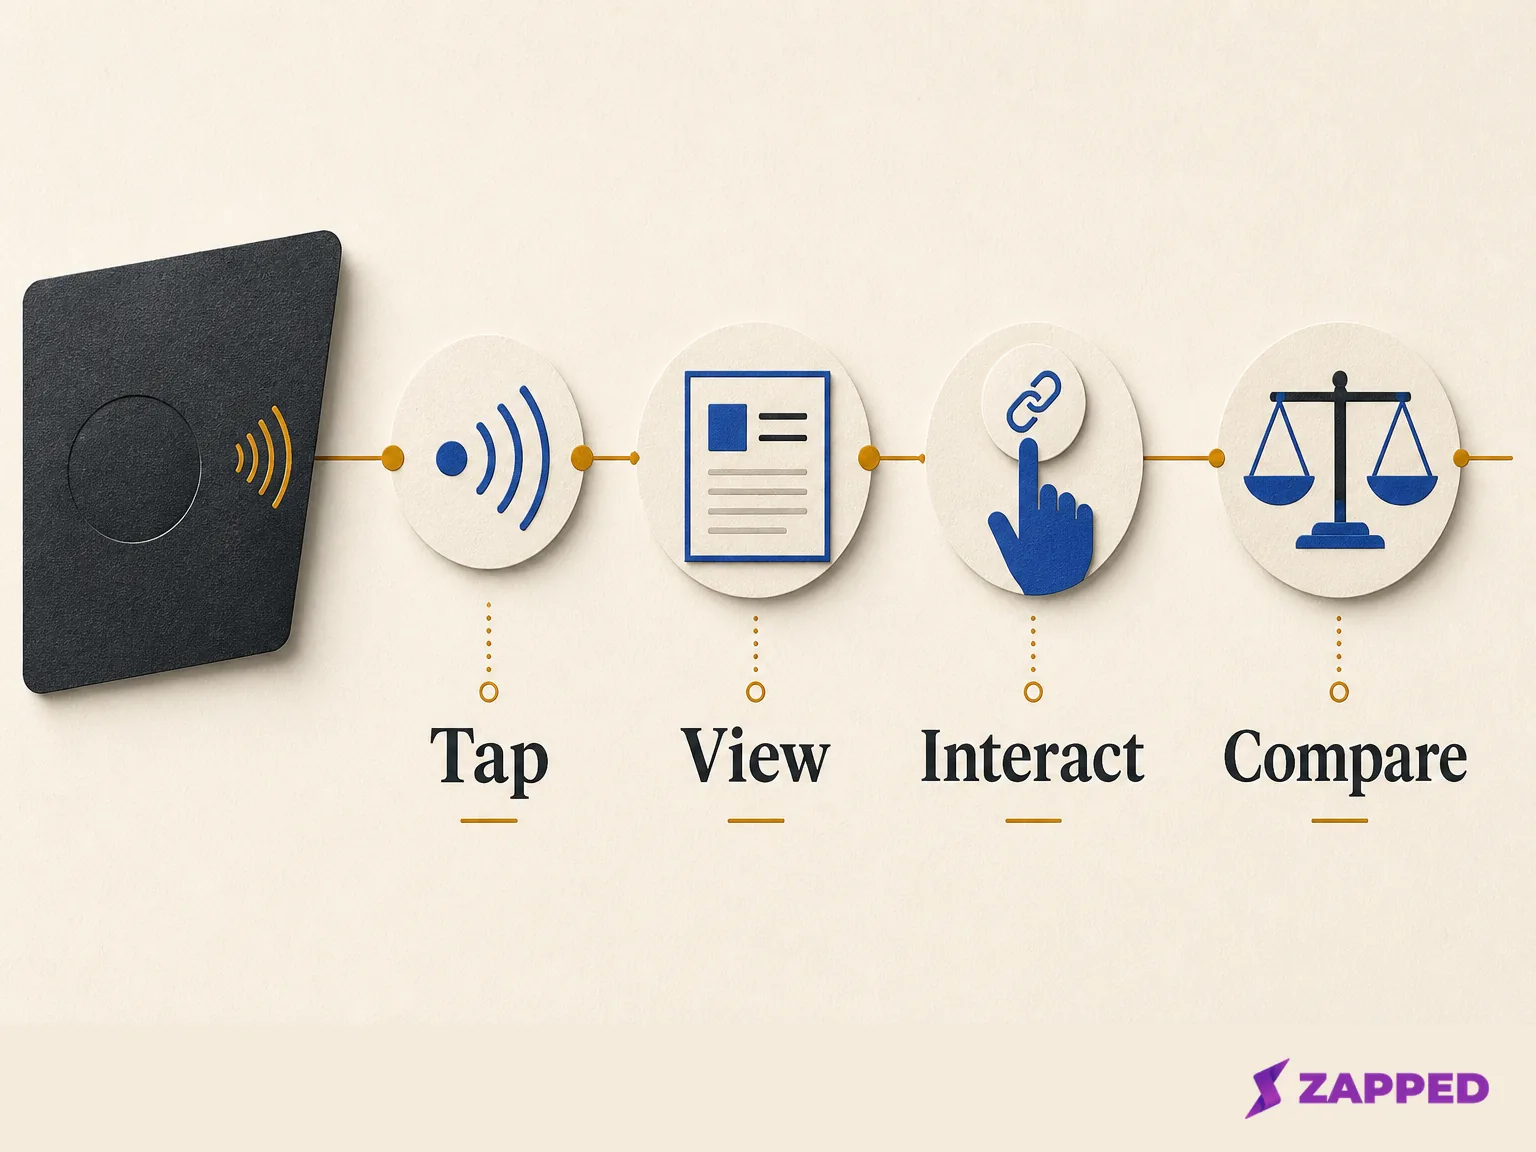
The useful answer starts with a small funnel: tap or scan, card view, visitor count, source or device context, then an interaction. Keep those layers separate. A tap or view shows activity. It does not prove a sale or a qualified lead.
Start with the question your dashboard can answer
An NFC card creates a source event when someone taps it. That tap or scan count belongs beside the profile view count, not inside it. Zapped shows scans and taps separately from profile views, along with saved contacts, clicks, source activity, and campaign signals.
That separation gives you two useful checkpoints. Did the sharing method register activity? Did the public destination receive a visit? If the first number is healthy and the second is weak, you have a path to investigate instead of one vague “the card worked” score.
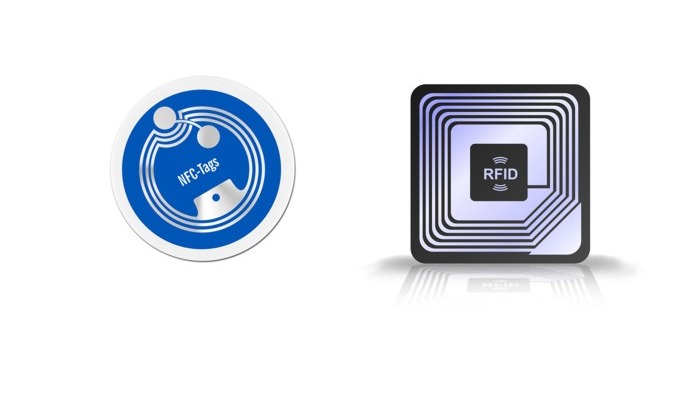
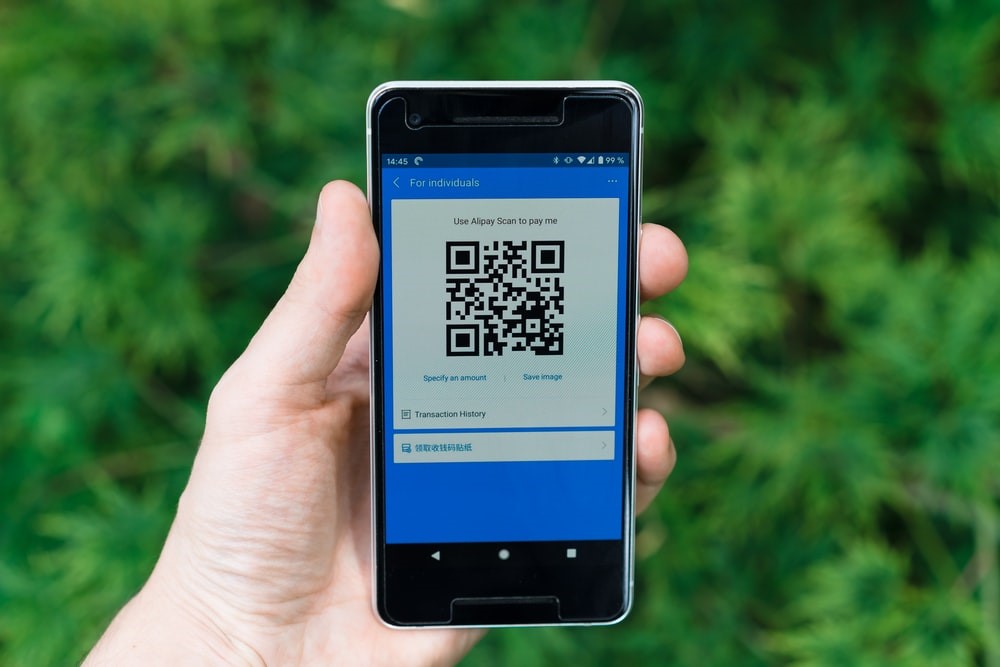
The destination matters more than the material. A Zapped card can open from an NFC tap, QR code, or ordinary browser link, so the recipient doesn’t need an app or an account. Program the NFC card with the public card URL, test it with another compatible phone, and keep a QR code or direct link nearby. If the tap is unreliable, the same profile still has a second route, and you can tell whether the problem is the card or the sharing moment.
Four counts, four questions
Treat the dashboard as a set of questions, not a scoreboard.
| Signal | The question it answers | What it cannot establish on its own |
|---|---|---|
| Tap or scan | Did the NFC or QR sharing path register activity? | That the public card loaded or that a person took a business action |
| Views | Was the public card opened? | That every view was a different person or that anyone became a lead |
| Visitors | How many visitor records did the platform identify in the window? | A guaranteed unique person count unless the provider defines it that way |
| Interactions | Did someone tap a configured contact or link action? | A conversion, sale, qualified lead, or CRM record |
The gap between views and visitors is where many post event reports go wrong. Zapped defines them as different statistics because one visitor can open a card more than once. If views are higher than visitors, consider repeat opens. Don’t turn the visitor number into a perfect count of people.
Interactions answer a different question. In Zapped statistics, an interaction is an action such as tapping a configured contact or link action on the card. Compare interactions with views to see whether the page gave visitors a next move, then inspect which configured action received attention.
That’s engagement evidence. Calling it a conversion rate does not make it one.
The clean reading is: taps or scans describe the route into the card, views describe the page opening, visitors add a platform defined visitor layer, and interactions describe a chosen action. Keep the layers intact before you compare them.
When source and device context should change the plan
Referrer and device fields are useful when they change what you do next. Zapped’s statistics can include devices and referrers when available, and its guidance is to use that context with views and interactions when deciding where to share a card next.
Suppose one sharing route produces taps but little view activity. Check the public destination and the date window before blaming the audience. If the profile opens but one source produces more interactions than another, keep the profile stable and change the distribution method you can control. Use a consistent date range, then compare again.
Device context can support that decision too. A pattern tied to one device group may tell you to make the QR path more prominent or explain the tap more clearly at the event. It doesn’t tell you why every person behaved that way, and it doesn’t turn aggregate activity into an identity record.
If you need setup details for staff, shared cards, and the handoff before you start measuring, use the event setup guide.
Check the history window before calling it a trend
An event snapshot and a team trend are different reports. Before comparing them, check how much history your plan actually keeps.
Zapped lists 60, 185, and 365 days on Free, Starter, and Professional, checked in August 2026. That plan limit changes what the numbers can tell you. A short window can answer what happened at the last event. It can’t support a year over year comparison once the earlier period is outside the available history.
There’s a useful silence here: the current public plan comparison doesn’t say what happens to stored analytics after a subscription lapses. Don’t build a reporting promise around history you haven’t confirmed. Export or record the decision making numbers while they’re available, especially if the result will be used across a longer team review.
“Analytics” can mean a card report or a team system
The word analytics gets broader as the product gets closer to lead operations. Two dashboards can use the same word while answering different questions.
| Platform example | What its published material describes |
|---|---|
| Zapped | Per card views, visitors, interactions, devices, and referrers, with scan and tap signals kept separate from page activity |
| Popl | Engagement analytics alongside lead capture and exports to CSV, Outlook, and CRM systems |
| Blinq | Event, rep, and campaign tags, pipeline attribution, ROI reporting, and team performance |
Popl’s team material also describes reporting by event, rep, and region. That’s a different operating layer from asking whether one card opened after one tap.
The distinction matters when someone asks for “the analytics” and quietly means lead capture, CRM export, or team attribution. If your next decision is moving from aggregate card activity into fields, ownership, and downstream systems, continue with the guide to NFC business card CRM integration. The dashboard can show attention. A CRM workflow is where you decide what information becomes part of follow up.
What to do when the result is empty or strangely low
An empty dashboard is a recovery task, not a verdict on the event.
Open the public card URL directly and confirm that the card was actually shared and opened. Check the selected date range. Then make sure the person didn’t use a different card link. Those checks cover the ordinary ways a valid interaction can end up outside the report you’re looking at.
Next, test the action you expect visitors to take. Open the public profile, tap the configured contact or link action, and keep the QR path beside the NFC path. If the card points to the wrong profile, rewrite the NFC destination with the correct public URL.
A Zapped NFC card stores one destination at a time. Changing that destination means reprogramming the card. Updates to the profile at that same URL can continue without rewriting it.
The fallback is part of the measurement design. A QR code or direct link lets someone reach the profile when the phone doesn’t read NFC reliably, and it gives you a second route for checking whether the public page works. We’d start digital and reach for hardware only when a specific event calls for it. The card should make sharing easier, not make a missing counter impossible to diagnose.
A small review loop beats a grand report
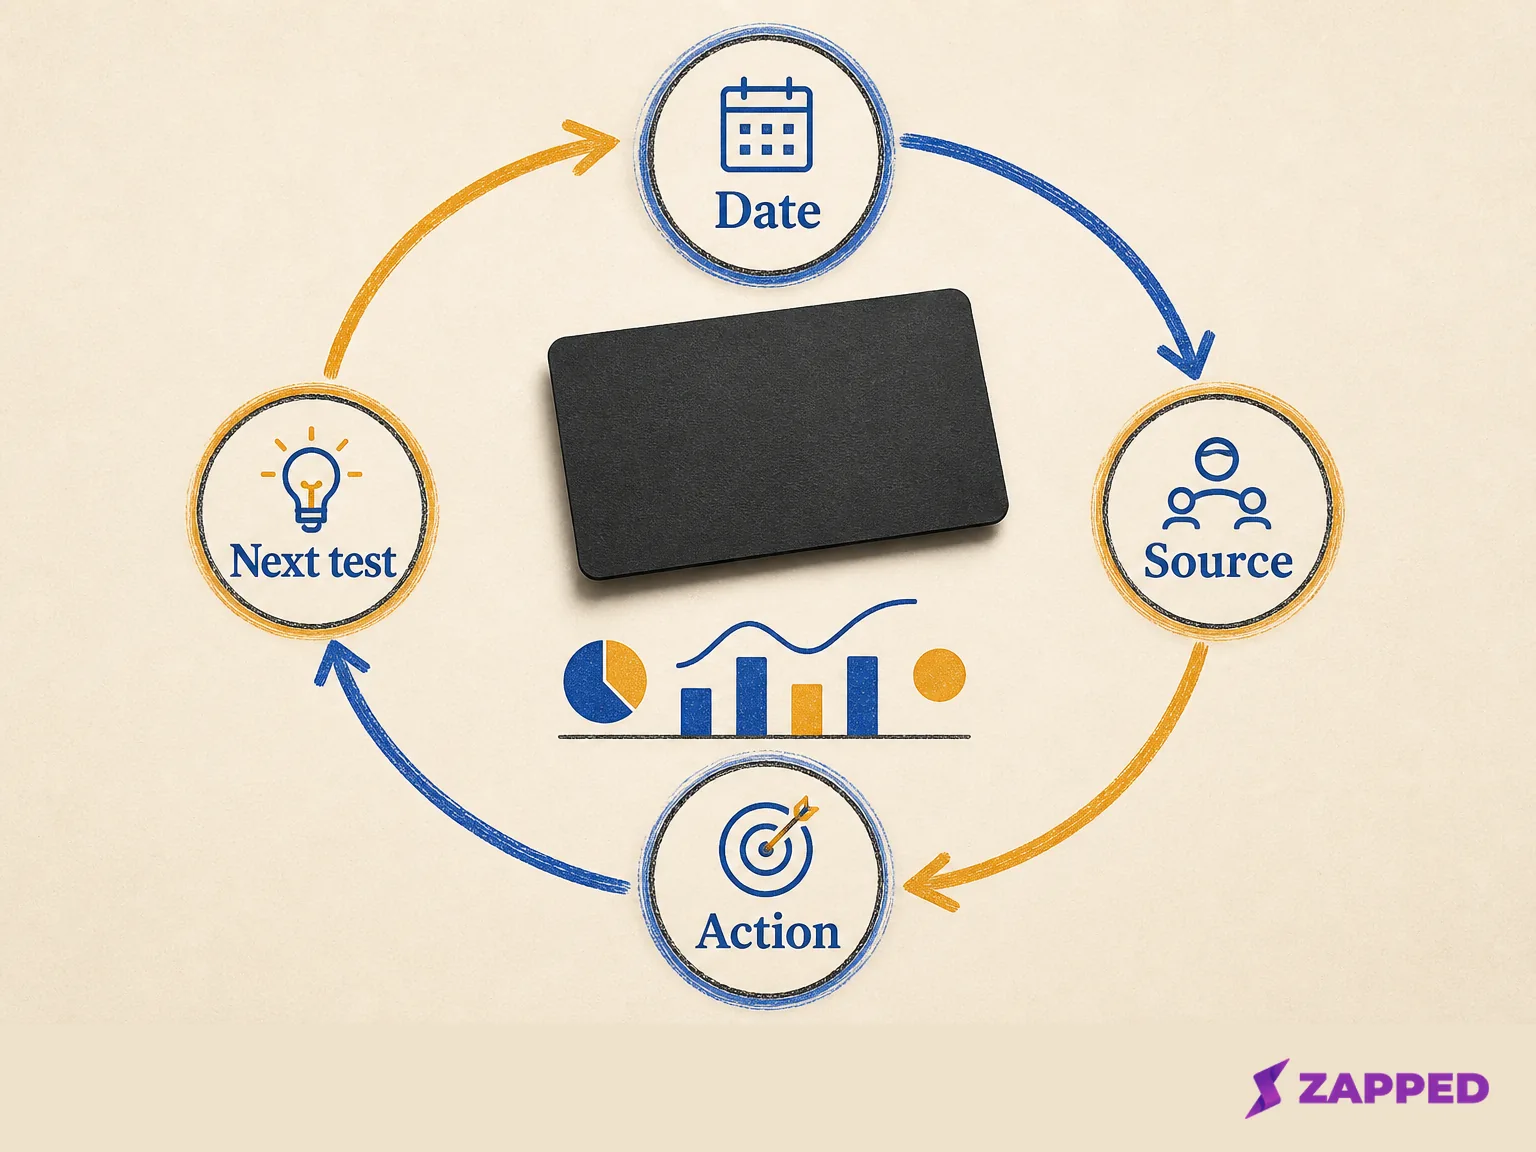
Use the dashboard in this order:
- Verify the public destination with the direct URL and the QR fallback.
- Set the date window to the event or comparison period you actually mean.
- Read taps and scans beside views, then compare views with visitors.
- Compare interactions with views and inspect the configured contact or link actions.
- Check referrers and devices when available, change one sharing method or card action, and check the same measures again.
That loop keeps a physical event, a page opening, a visitor estimate, and a chosen action from becoming one inflated success number. It also gives every low result a next question.
The boundary is just as useful as the measurement. Aggregate engagement can tell you that a card was opened and that an action received attention. It can’t, by itself, prove a sale, a qualified lead, or a CRM record. If the handoff now belongs to individual reps and their follow up, use the guide to NFC business cards for sales reps.
Buy into NFC analytics when you want a readable trail from sharing method to public card to chosen action, and you’re willing to preserve a QR or direct link fallback. Skip the grand “success rate” report if the dashboard doesn’t define its visitor logic, its date window is too short, or the result you need is CRM and revenue attribution.
Start with one card, one change, and one consistent comparison period. That’s enough to learn what the next event should do differently.