There is no single authoritative public number for the digital business card market. The three current 2025 global estimates run from IMARC's USD 194.2 million through Mordor's USD 199.39 million to Market Research Future's USD 213.50 million.
That range is useful, but only with the measuring stick attached. Treat each figure as a publisher's modeled revenue estimate. Then match the base year, forecast window, market definition, geography, and method before you use it in a business case, forecast, or product decision. If you want the broad definition first, start with digital business cards; the market number makes more sense once you know what the category includes.
Pick the baseline before the endpoint
When a business case asks for the digital business card market size, it usually wants one number that can survive a sentence. Choose the publisher and year first, then explain why that series fits the question.
For a general category citation, start with IMARC's USD 194.2 million estimate for 2025. Its public page defines a digital business card as a virtual representation of professional information accessed through smartphones, email signatures, or social profiles, and it lays out cuts by platform, user type, vertical, and region. That makes the citation legible, not more accurate than the other two.
Mordor reports USD 199.39 million for 2025, while Market Research Future reports USD 213.50 million. The spread is USD 19.3 million before you account for different boundaries and methods. Don't average the three and call the result the market. A blended number hides the disagreement your reader, investor, or finance team needs to see.
Method is another measuring stick. Market Research Future says its estimates draw on interviews with more than 120 platform vendors, CRM integration partners, and enterprise procurement officers, then triangulates those interviews with public revenue disclosures and app store download analytics. Mordor describes a proprietary estimation framework updated with data and insights through January 2026. IMARC publishes market values, segment scope, and drivers, but its public page has no calculation table. Those descriptions tell you how each publisher says it built the estimate. They don't turn unlike methods into one shared data set.
Write the practical sentence like this: name the publisher, attach the 2025 base year, state that the figure is a modeled global revenue estimate, and keep the source's definition nearby. If your question is narrower than that, the headline number is already too broad.
Forecast endpoints are not interchangeable
Forecasts are clocks, not finish lines. Mordor's 2031 forecast reaches USD 331.78 million from a 2026 base at an 8.86% CAGR. IMARC's 2034 forecast reaches USD 412.2 million at an 8.46% CAGR from 2026 to 2034. Market Research Future's 2035 forecast reaches USD 528.12 million at a 9.48% CAGR from 2026 to 2035.
Those are different time windows. A 2031 total has had fewer years to grow than a 2035 total, so ranking the dollar figures as though they were competing answers produces a false winner. Align the endpoint and the CAGR period first. If you need a 2035 view, use a series that actually models to 2035 or label any extension as your own scenario rather than the publisher's forecast.
Allied Market Research's older series starts at USD 159.4 million in 2022 and projects USD 505.2 million by 2032, with a stated 12.6% CAGR from 2023 to 2032. It is not interchangeable with a 2025 estimate simply because both pages use the phrase digital business card market. The base year, growth interval, and likely market boundary have changed.
The four series line up like this once each number carries its own window:
| Publisher | 2025 estimate | 2026 estimate | Forecast endpoint | Stated CAGR |
|---|---|---|---|---|
| IMARC | USD 194.2 million | not published | USD 412.2 million in 2034 | 8.46% for 2026 to 2034 |
| Mordor Intelligence | USD 199.39 million | USD 217.04 million | USD 331.78 million in 2031 | 8.86% for 2026 to 2031 |
| Market Research Future | USD 213.50 million | USD 233.74 million | USD 528.12 million in 2035 | 9.48% for 2026 to 2035 |
| Allied Market Research | 2022 base of USD 159.4 million | not published | USD 505.2 million in 2032 | 12.6% for 2023 to 2032 |
Read the last two columns together. Market Research Future carries both the largest endpoint and the longest runway, so it wins any ranking that ignores the window and stops winning as soon as you align the periods. Allied's 12.6% is the steepest rate on the page and starts from the oldest base, which is the combination most likely to be quoted out of context.

For an article or forecast, write the comparison as a timeline: 2025 baseline, forecast start, forecast endpoint, and CAGR period. That small discipline does more for credibility than picking the most dramatic ending number.
The segment tree changes the meaning
Market size is a category label sitting on top of several different cuts. IMARC's segment tree separates Android, iOS, and Windows platforms; business, enterprise, and individual users; verticals; and regions. Those are different slices. A platform share answers a different question from a user type share, and neither tells you how much a particular team will spend.
Mordor's segment figures put North America at 35.17% of 2025 market share and annual subscriptions at 41.23% of 2025 pricing model share. It also gives freemium plans a 10.66% CAGR segment through 2031. Those figures are useful when your question is about region, pricing model, or growth within a segment. They don't describe every publisher's market.
The older Allied segment view shows why dates matter: North America represented 35% of its 2022 industry share, Android represented more than 64% of 2022 revenue share, business users represented 67%, and India carried a 19.5% forecast CAGR from 2023 to 2032. The two North America figures look close enough to tempt a clean comparison. They are still from different years and different publisher models.
Choose the segment that matches the decision. A regional launch needs regional evidence. A consumer app needs user type and platform evidence. A team purchase needs pricing model, account structure, and rollout evidence. A global market total alone cannot answer any of those cleanly.
What the number can support
Revenue is revenue. It gives you category context, a sense of modeled scale, and a starting point for comparing research coverage. It doesn't give you active users, cards issued, scans, or a vendor's market share.
The public research pages do not provide a common audited data set or a reliable count across vendors for those operating measures. Mordor's public data is still a publisher's model, even when it gives a regional or platform share. Turning USD 199.39 million into a user count requires assumptions about pricing, free usage, renewal, geography, and product mix that the public market total does not supply.
That boundary matters in an investment memo. You can write, “Mordor estimates the global market at USD 199.39 million in 2025,” and use it as category context. You cannot write, “there are roughly X digital business card users,” unless you have a separate source and a separate calculation that supports X.
The same rule applies to vendor comparisons. A growing category does not prove that one platform owns a given share, that a card will convert a contact, or that your audience will adopt the format. Those are product and behavior questions.
Adoption starts after the number
Once the category estimate has done its limited job, decide what the handoff needs to accomplish. Is the goal a simple link, QR code, or NFC share? Does the destination need to stay editable after the card is printed? Do you need analytics to see which networking moments work? Will several people manage cards, domains, or bulk uploads?
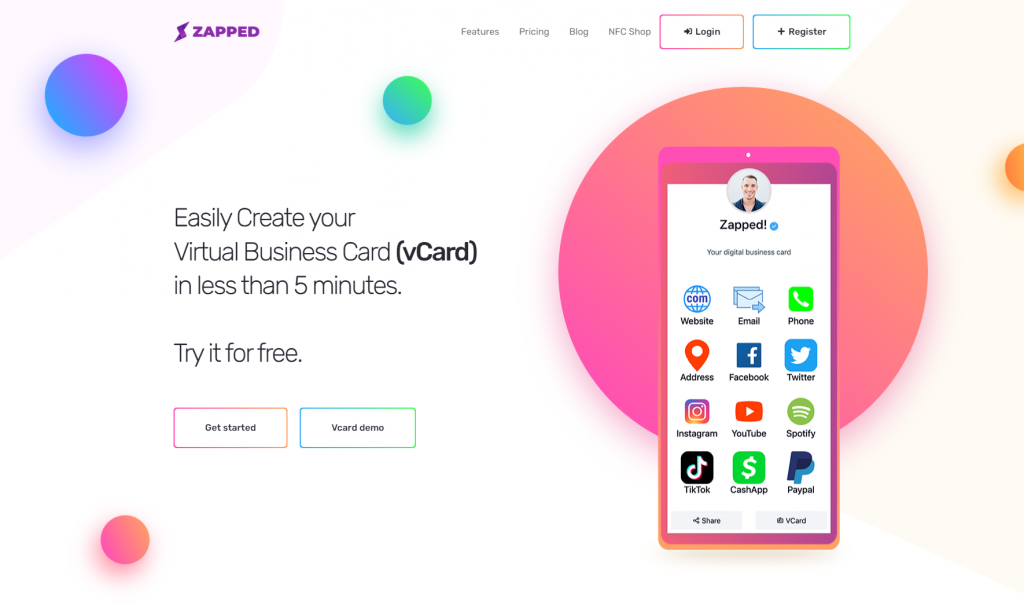
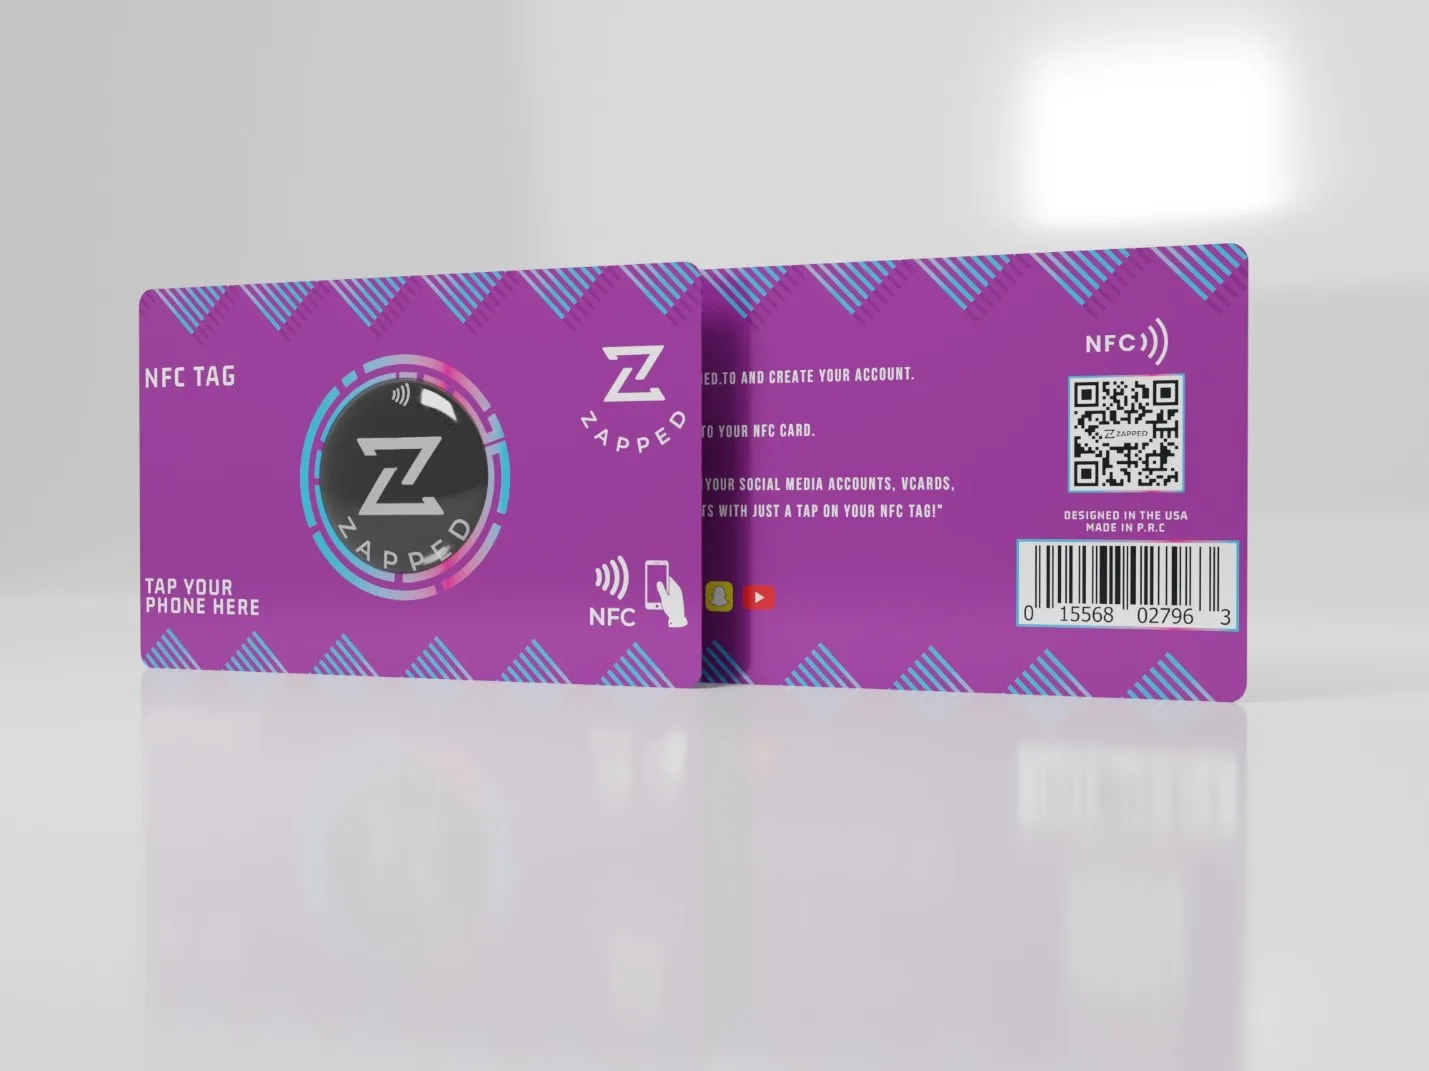
Zapped is one concrete example of those distinctions. Its sharing path uses a link, QR code, or NFC tap, and the card opens in a normal browser without asking the recipient to install an app. The profile stays live after edits, so the shared link or printed QR code can continue to point to the current details. That solves recipient friction and stale contact information. It does not, by itself, solve every follow through or customer relationship task.
The measurement and rollout question is separate. Zapped provides analytics per card, with history set by plan, and paid plans add team workspaces, member seats, and roles. A person who only needs a profile and a link should not pay for a team system. A team that needs to see which cards work or manage a shared rollout should not choose on tap novelty alone.
The dated price test is concrete. Zapped's monthly billing view, captured in August 2026, lists Free at USD 0 with no credit card, Starter at USD 14 per month, and Professional at USD 49 per month. Free includes one card, five content blocks, QR and link sharing, and 60 days of analytics history. Professional includes 100 cards and five team workspaces. A rollout of 100 or more cards, with bulk uploads, dedicated domains, and custom integrations, uses a custom quote. These are monthly plan prices, not averages for the category.
That gives you a low risk trial and a clear upgrade question. Start with Free if the job is to test whether people open and save the profile. Move to a paid plan when the number of cards, analytics history, team access, or rollout controls become the actual constraint. If the next decision is which vendor fits those needs, use best digital business card rather than pretending a market size report can rank products.

The real test is the editable destination
The hardware or QR code is only the entrance. The destination determines whether the exchange stays useful after the meeting.
In Tefeli's 90 day NFC test of nine UK NFC cards, only four let the reviewer change role, company, or contact details after printing without paying again or contacting support. That's a small independent test, not a market statistic. It's still a sharp buying criterion: ask what you can edit after the card is in circulation, and what happens when the person who set it up is unavailable.
An attributed community observation points to a second gap. A Reddit observation from a participant who said they had attended hundreds of conferences described digital business cards as one way traffic when the goal is capturing the other person's details, while paper cards still appear in more traditional sectors. The point is not that one format wins. The point is that sharing your details and collecting someone else's details are different jobs.
So the adoption question should include the next step. Can the recipient save the contact? Can you change the destination? Can you see a click or scan? Can a team keep the profile current? Can the workflow capture the other person's details, or does it stop at your own card? A large category forecast cannot answer those questions. A short pilot can.

Use the range, then measure your own audience
If you need a budget or adoption forecast, use the public estimates as category context and keep the publisher attached to every number. Do not turn IMARC's USD 194.2 million, Mordor's USD 199.39 million, or Market Research Future's USD 213.50 million into a promise about your conversion rate. The reports are not a substitute for your audience's behavior.
Run a small pilot in the setting that matters. Measure scans, saves, clicks, or captured contacts, then compare those results with the cost of the plan and the time required to keep profiles current. Keep a QR or printed fallback for people who do not want a tap. We would start digital and add hardware only after the events made it necessary.
The final choice is narrower than “is the digital business card market big enough?” Cite a 2025 estimate when you need a defensible revenue baseline. Align endpoint years before you compare growth. Match the segment to the decision. Skip the market number as a proxy for users or vendor share. Then choose the sharing, editing, measurement, and team controls your handoff requires.
The number is useful when its ruler stays visible. Remove the ruler, and a confident forecast is just a very polished way to lose the plot.